In this project we explore the 2013-2014 NBA Season to determine which type of shooting attempts had the most correlation to points being scored per game. We compare the player's free throw shooting attempts, two points shooting attempts and three point shooting attempts to find out which attempts led to most points per game during the course of the 2013-2014 Season.


In this project, we use Python to see if there is high coorelation between gross revenues and other movie features. We hypothesised in this project that budget and name of the producing company will have high correlation with the gross revenues.

In this project, we use regression model to predict the price of medical charge based on the provided features.
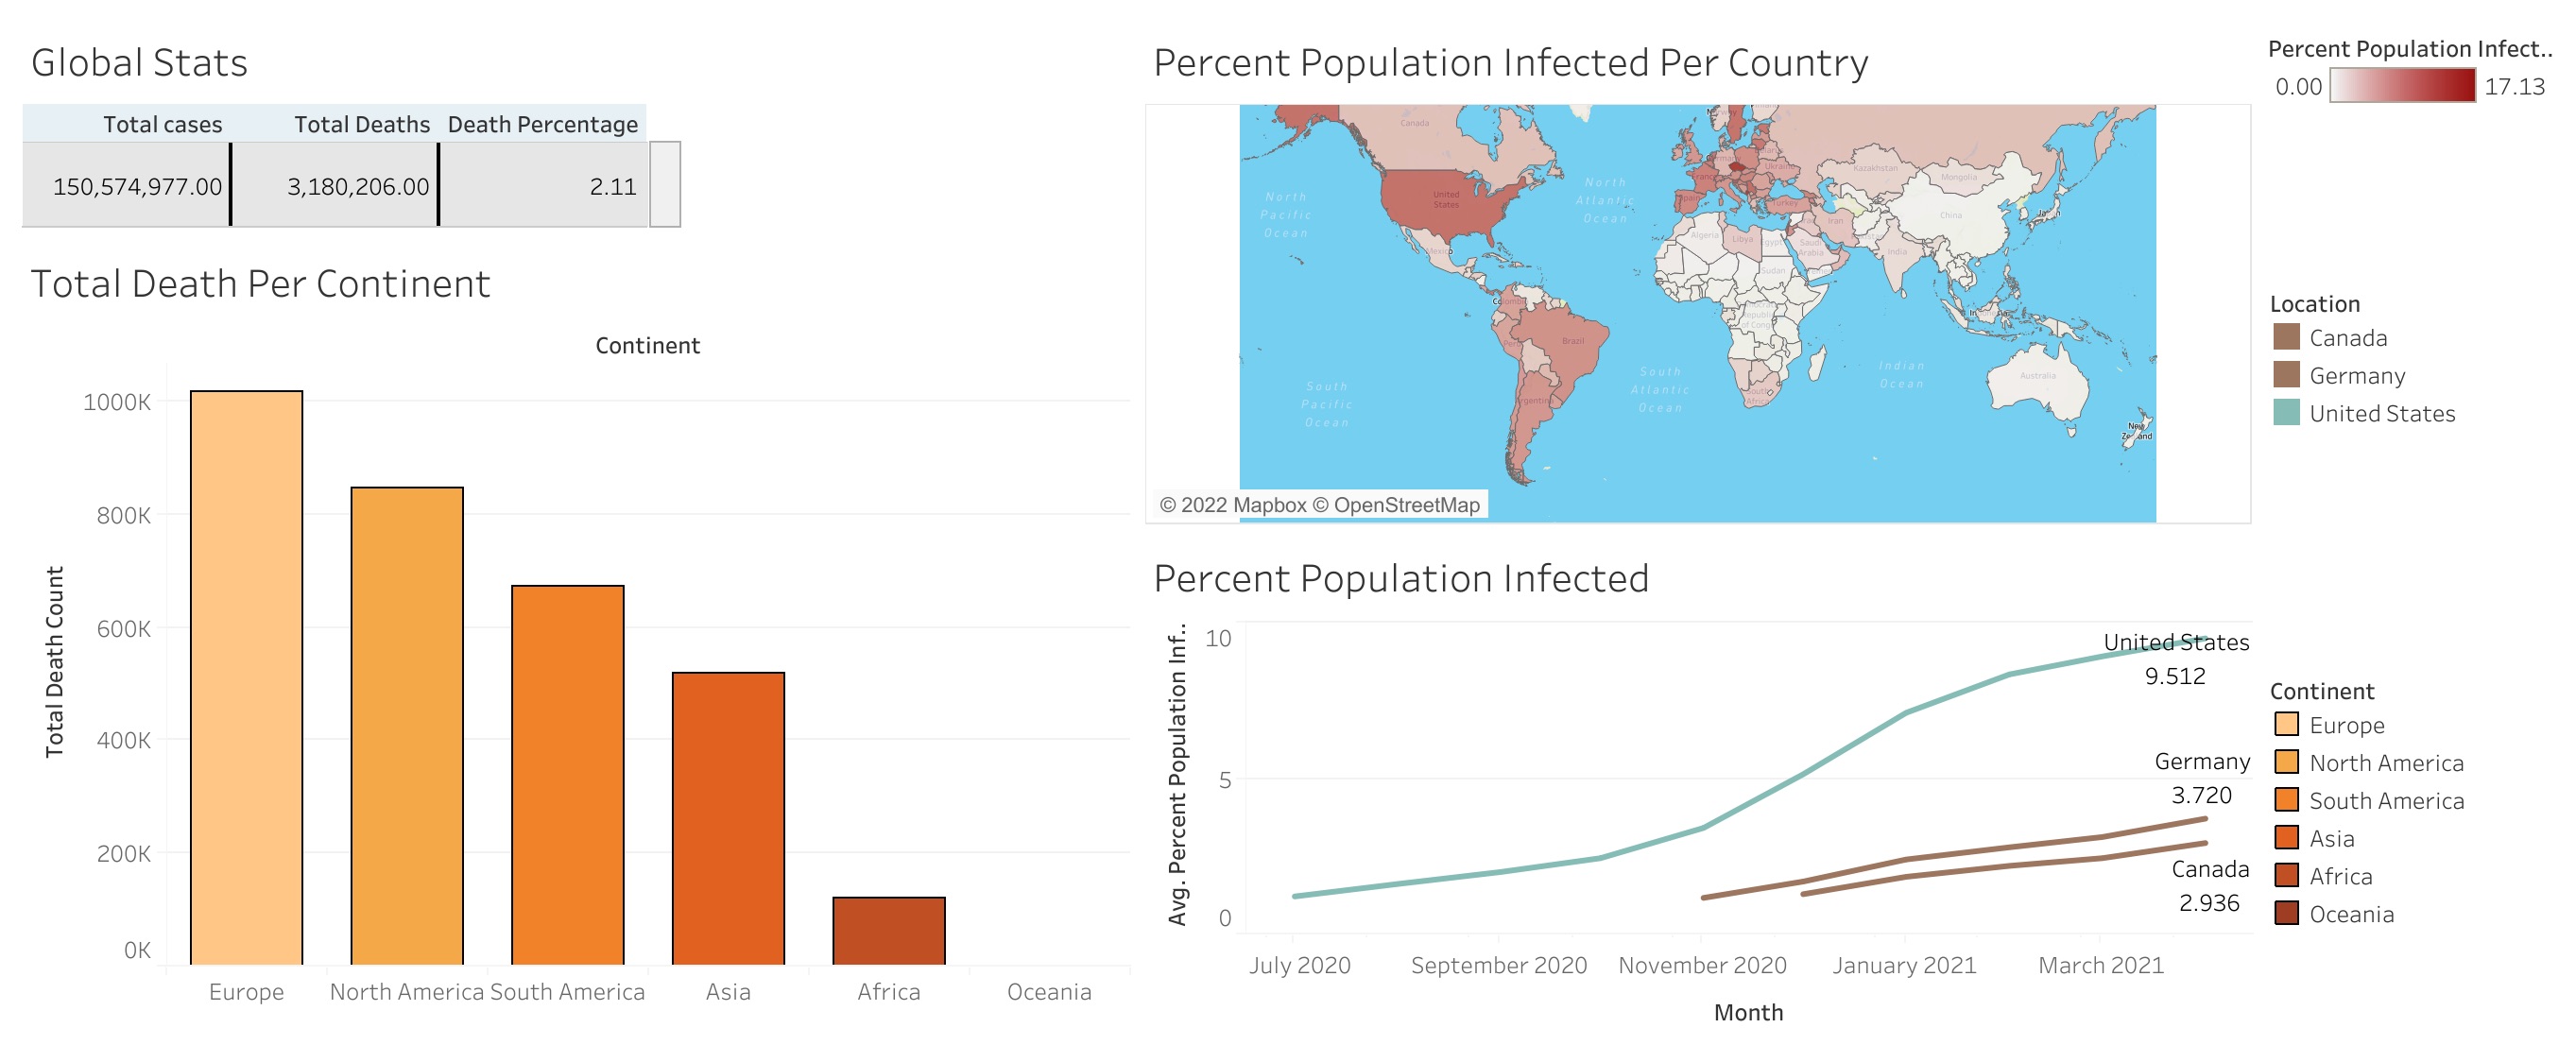
Using Tableau, we provide a different aspect in data exploration. We explore the world of data visualization to help our stakeholders or audience make better decisions or grasp the knowledge of the dataset better.
 Small.jpeg)
Using SQL to gain valuable insight on sales over time, location and property type.

In this project, we use classifiaction model to predict, if the customer will stay or leave based on the features provided.